HINT-BC: Addressing DNase-seq cleavage bias and residence time on computational footprinting
Eduardo Gade Gusmao, Manuel Allhoff, Martin Zenke and Ivan Gesteira Costa.
Method
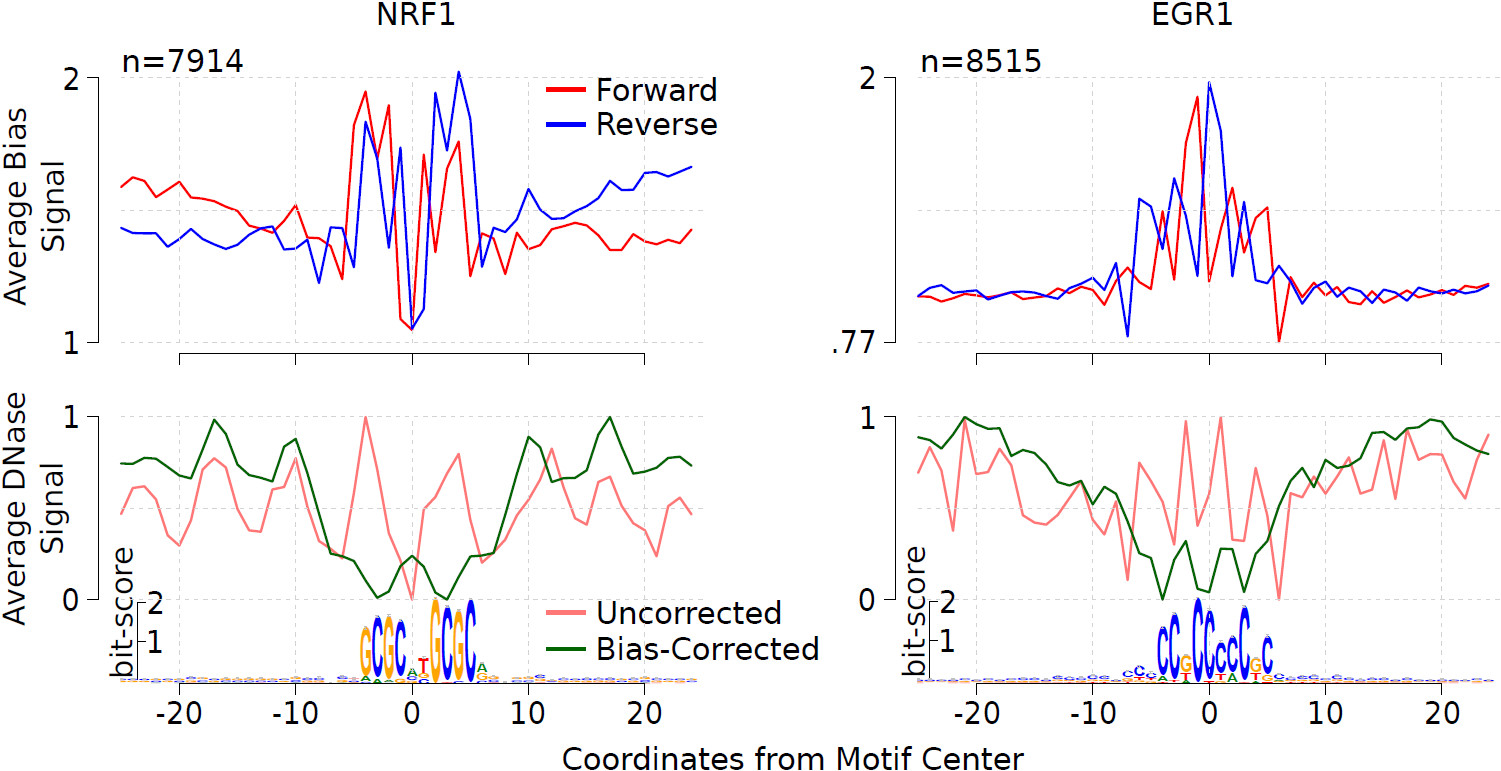
NGS-based data are significantly affected by biases, which are inherent to the experimental protocols. Since we are interested in computational footprinting with DNase-seq data, we investigated these biases using a computational approach. One major artifact of DNase-seq experiments is the cleavage bias, which is due to DNase I having different binding affinities towards specific DNA sequences. It has been shown that such bias has an impact on computational footprinting. Another experimental aspect affecting the computational analysis of DNase-seq is the residence time of TF binding. It has been shown that short-lived TFs display a lower DNase I cleavage protection pattern, i.e. a low number of DNase-seq reads around the footprint. Moreover, short-lived TFs as nuclear receptors have DNase-seq profiles resembling cleavage bias estimates. We extended our previous method HINT (Hmm-based IdeNtification of Tf footprints) to incorporate bias-corrected DNase-seq signal. This novel method is called HINT bias-corrected (HINT-BC). In this novel approach, cleavage bias is corrected and a statistics is used to point out potential transient TFs. We show that HINT-BC outperforms all evaluated competing methods.
Software
2. Evaluate transcription factors with potential short binding time.
Benchmark
We provide scripts and data for benchmarking computational footprint methods on either TF ChIP-seq or expression data.
TF ChIP-seq Based Evaluation
This evaluation methodology uses motif-predicted binding sites (MPBSs) together with TF ChIP-seq data to evaluate the footprint predictions. We provide the scripts and data to perform the evaluation procedure.
1. Download here the TF ChIP-seq based evaluation code and examples of MPBSs and HINT-BC footprints for H1-hESC.
2. Extract the code’s folder, and execute this command within the folder:
python chipValidation.py DU_H1hesc.bed DU_H1hesc_HINTBC.bed
If you want to evaluate the predictions of your computational footprinting method on H1-hESC cells, simply replace the file “DU_H1hesc_HINTBC.bed” in the command above with the file with your predictions. For more information on the input files and optional input parameters please type:
python chipValidation.py -h
This code has the following requirements:
- Python (>=2.6)
- Numpy (>=1.8)
- Scipy (>=0.14)
- Scikit-learn (>=0.14)
The output consists of:
- *_roc.txt file: Tab-delimited table containing the points of the ROC curve. For each factor we procide the x-axis points (_FPR) and y-axis points (_TPR).
- *_prc.txt file: Tab-delimited table containing the points of the PR curve. For each factor we procide the x-axis points (_REC) and y-axis points (_PRE).
- *_stats file: Tab-delimited table containing the area under the ROC curve (at 1%, 10% and 100% FPR) and area under the PR (AUPR) curve for each factor.
FLR-Exp Evaluation
This evaluation methodology uses MPBSs together with TF expression data to evaluate the footprint predictions. We provide the scripts and data to perform the evaluation procedure.
1. Download here the FLR-Exp evaluation code and examples of MPBSs, TF expression and HINT-BC footprints for the cells H1-hESC and K562.
2. Extract the code’s folder, and execute this command within the folder:
python flrexpValidation.py TF_Expression_H1hesc_K562.txt DU_H1hesc_FLR.bed DU_K562_FLR.bed DU_H1hesc_HINTBC.bed DU_K562_HINTBC.bed
If you want to evaluate the predictions of your computational footprinting method on H1-hESC and K562 cells, simply replace the file “DU_H1hesc_HINTBC.bed” and “DU_k562_HINTBC.bed” in the command above with the file with your predictions. For more information on the input files and optional input parameters please type:
python flrexpValidation.py -h
This code has the following requirements:
The output consists of:
- *_flrexp.txt file: Tab-delimited table containing the KS test statistic (ks_stat) and p-value (ks_pvalue) for each tested factor. The last line of this file contains the FLR-Exp value (correlation between expression fold change and KS test statistic) and its p-value.
Benchmarking Data
We also make available the complete benchmarking data:
- Expression fold change tables are available for all evaluated cell type pairs.
- Benchmark evaluation dataset (gold standard MPBSs):
- ChIP-seq based MPBSs:
- FLR-Exp MPBSs:
- Footprints for all methods:
- Segmentation-based methods and site-centric methods for ChIP-seq based MPBSs:
- Site-centric methods for FLR-Exp MPBSs:
Additional Results
We make available additional experimental results:
- Additional graphical results:
- Detailed 6-mer bias estimation for all DNase-seq datasets used.
Citing
If you use HINT/HINT-BC in your research, we kindly ask you to cite the following publication:
Gusmao EG, Allhoff M, Zenke M and Costa IG. “Analysis of computational footprinting methods for DNase sequencing experiments”. Nature Methods, 13(4):303-309, 2016. [Full Text]
Bibtex:
@article{gusmao2016,
 author = {Gusmao, Eduardo G. and Allhoff, Manuel and Zenke, Martin and Costa, Ivan G.},
 citeulike-article-id = {13947931},
 citeulike-linkout-0 = {http://dx.doi.org/10.1038/nmeth.3772},
 citeulike-linkout-1 = {http://dx.doi.org/10.1038/nmeth.3772},
 day = {22},
 doi = {10.1038/nmeth.3772},
 journal = {Nat Meth},
 keywords = {dnase, footprinting},
 month = feb,
 posted-at = {2016-03-01 17:51:59},
 priority = {2},
 publisher = {Nature Publishing Group, a division of Macmillan Publishers Limited. All Rights Reserved.},
 title = {Analysis of computational footprinting methods for {DNase} sequencing experiments},
 url = {http://dx.doi.org/10.1038/nmeth.3772},
 volume = {13},
 number = {4},
 pages = {303--309},
 year = {2016}
}